Quick answer
A nutrient deficiency chart helps you match leaf discoloration, stunted growth, or poor yields to specific missing elements so you can treat the root cause rather than guessing.
Why a dedicated chart beats general advice
Vegetable plants show different deficiency patterns than ornamentals or lawns. A chart designed for edibles groups symptoms by crop type and growth stage, making it faster to narrow down the problem. General online lists often mix up similar-looking issues, like nitrogen deficiency versus sulfur deficiency, which require different fixes.
What the Diggers chart covers that free resources miss
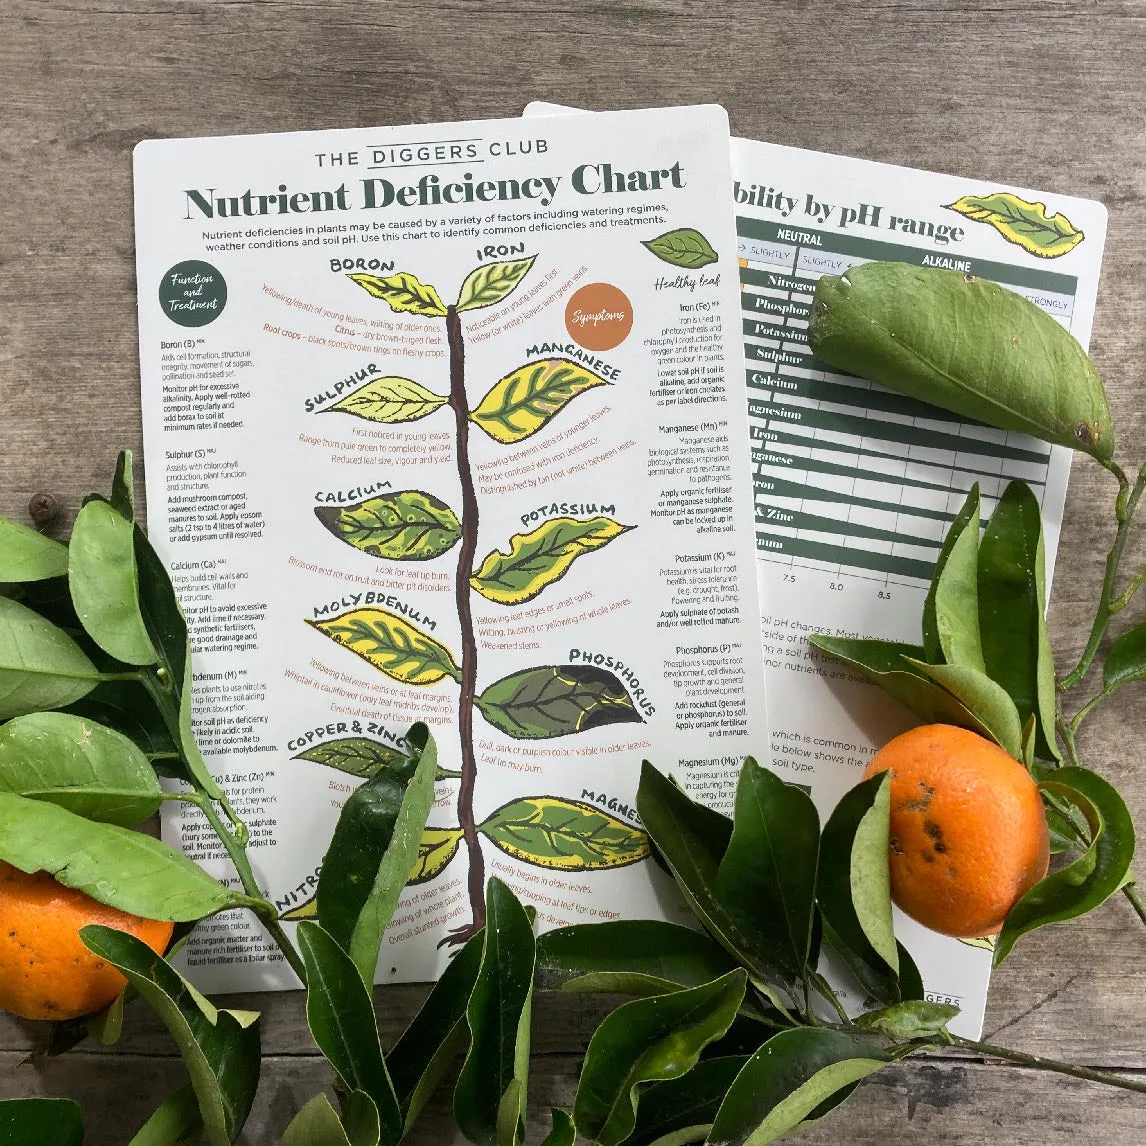
The Diggers Nutrient Deficiency Chart includes a pH ready reckoner that shows which nutrients become unavailable at different soil pH levels. Many free charts skip this link, so you might treat a deficiency that is actually caused by pH lockout. The chart also lists both major and minor elements, including boron and molybdenum, which are often overlooked in vegetable gardens.
How to use a nutrient deficiency chart for vegetables
- Step 1: Observe the whole plant and the oldest leaves first: Check whether symptoms appear on older lower leaves or new growth. Old-leaf yellowing usually points to nitrogen, phosphorus, or potassium. New-leaf distortion suggests calcium, boron, or iron. Take a photo of the affected area for comparison. Common mistake: treating the most visible leaf without checking whether it is old or new growth.
- Step 2: Match the symptom pattern on the chart: Look at the chart section for the specific vegetable type (leafy greens, fruiting crops, root vegetables). Compare the pattern of yellowing, browning, or spotting. Note whether veins stay green or turn pale. Checkpoint: If the pattern matches multiple deficiencies, test your soil pH first.
- Step 3: Cross-check with the pH ready reckoner: Use the chart's pH table to see if your soil pH is blocking uptake of the suspected nutrient. For example, iron deficiency often occurs above pH 7 even when iron is present in the soil. Common mistake: adding fertilizer when the real issue is pH lockout.
- Step 4: Apply the correct treatment in the right form: Choose a fast-acting foliar spray for quick correction or a slow-release soil amendment for long-term fix. Follow the chart's guidance on which form works best for each element. Checkpoint: Overcorrecting one nutrient can cause another deficiency, so apply only the recommended rate.
- Step 5: Monitor regrowth and adjust your feeding schedule: Check new growth after 5-7 days. If symptoms fade, continue with a balanced maintenance feed. If not, re-check pH and look for other causes like root damage or pests. Common mistake: assuming one application fixes the problem permanently without adjusting the long-term feeding plan.
Product fact
-
Diggers Nutrient Deficiency Chart: Our comprehensive nutrient deficiency chart is your one-stop guide to understanding the important functions of both the major and minor elements necessary for plant growth and performance. Having both major and minor elements in one place means you can check for uncommon deficiencies like zinc or copper without needing multiple references.
Diggers Nutrient Deficiency Chart